Digging into the earthworm survey

Earthworms are key indicators of soil health and ecosystem function so we’ve been checking on the numbers of earthworms in our soil at HCF for several years now. What have our surveys revealed? Andrew Ross explains.

Earthworm sampling is valuable at Highbridge Community Farm because earthworms are key indicators of soil health and ecosystem function. Their presence and diversity reflects soil fertility and the overall health of the ecosystem.

Earthworm activity, including their burrowing and castings, improves soil structure, aeration, and water infiltration, all of which are crucial for plant growth and overall soil fertility. The earthworms helps to create and maintain soil structure, which is essential for healthy root growth and water retention. 

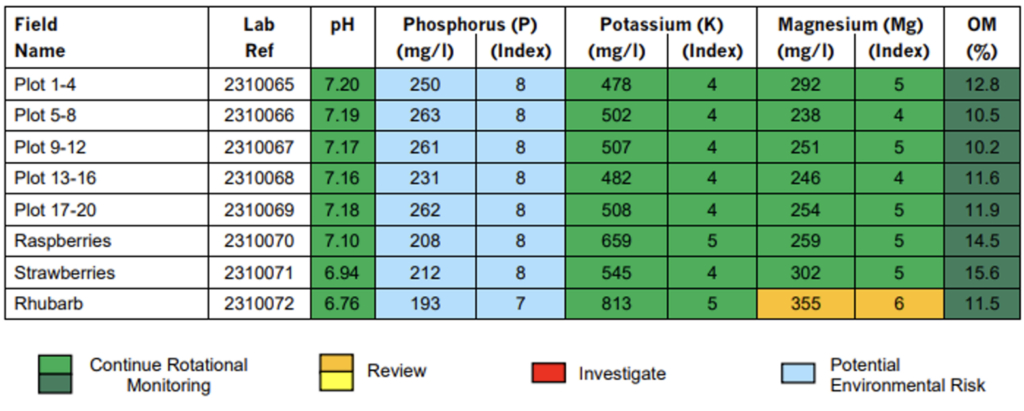
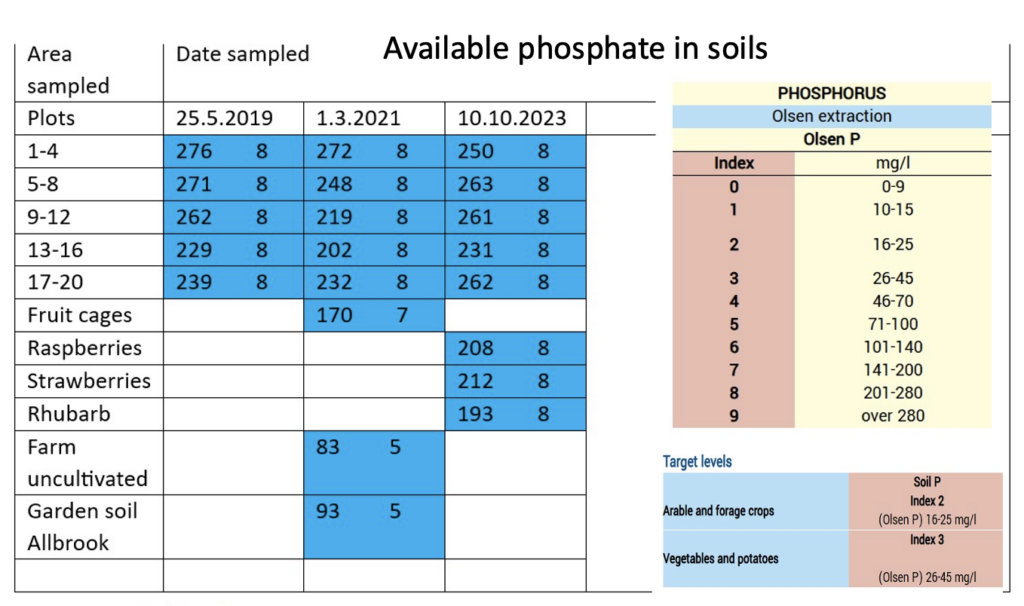
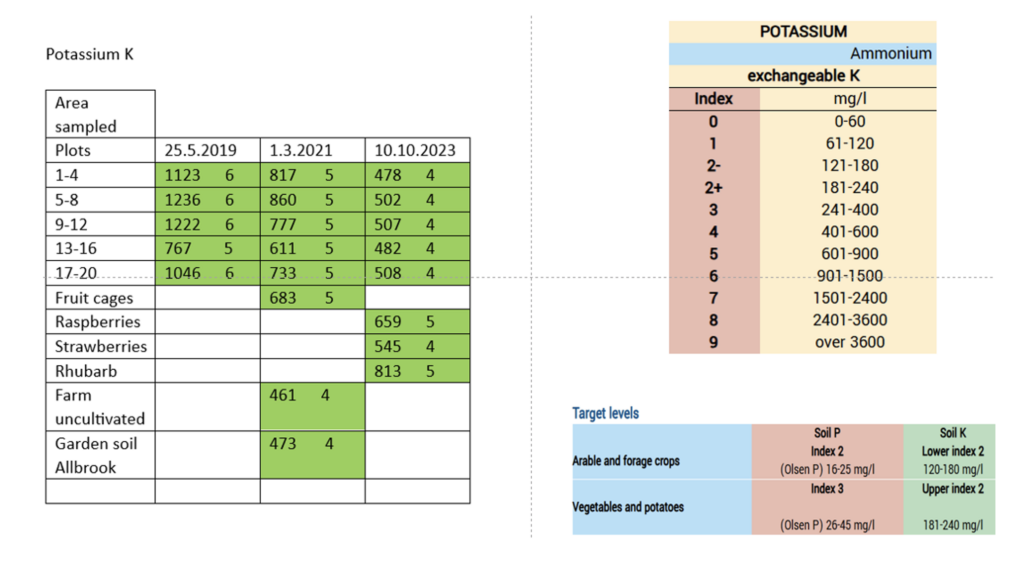
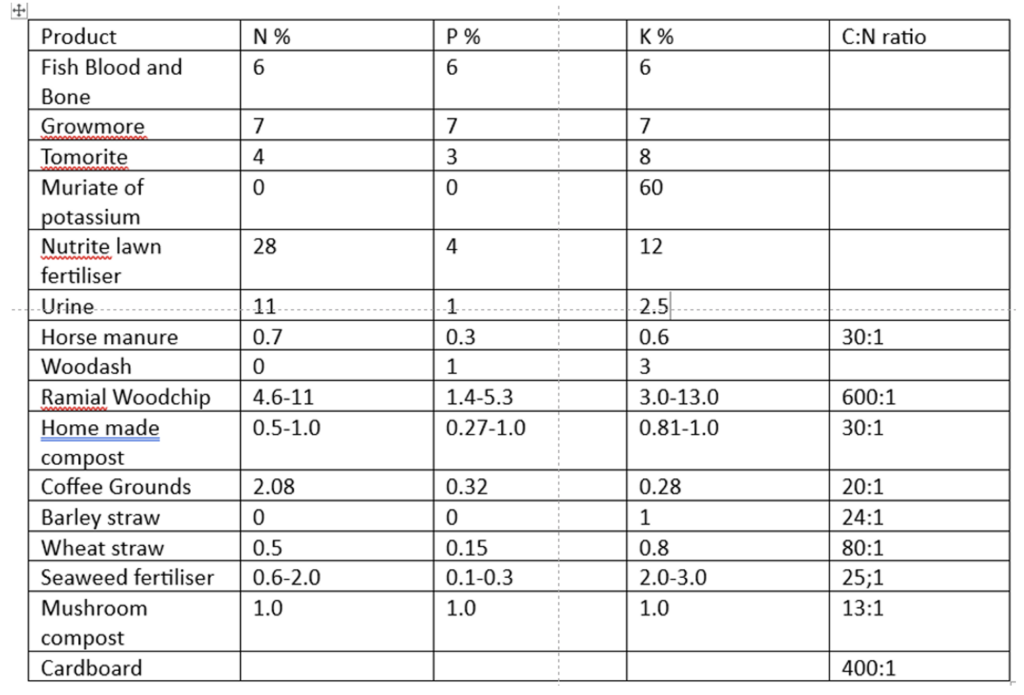
Earthworm sampling is one of a few ways we monitor the health of our soil. We also have a nutrient analysis conducted every two years or so, which tells us the levels of organic matter.
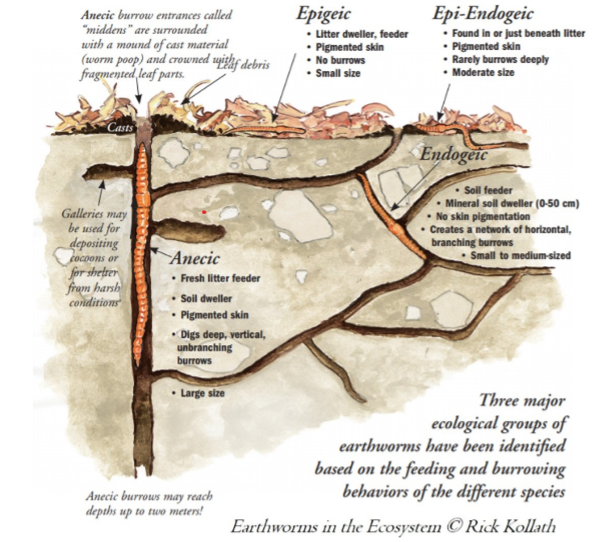
Three types of worm

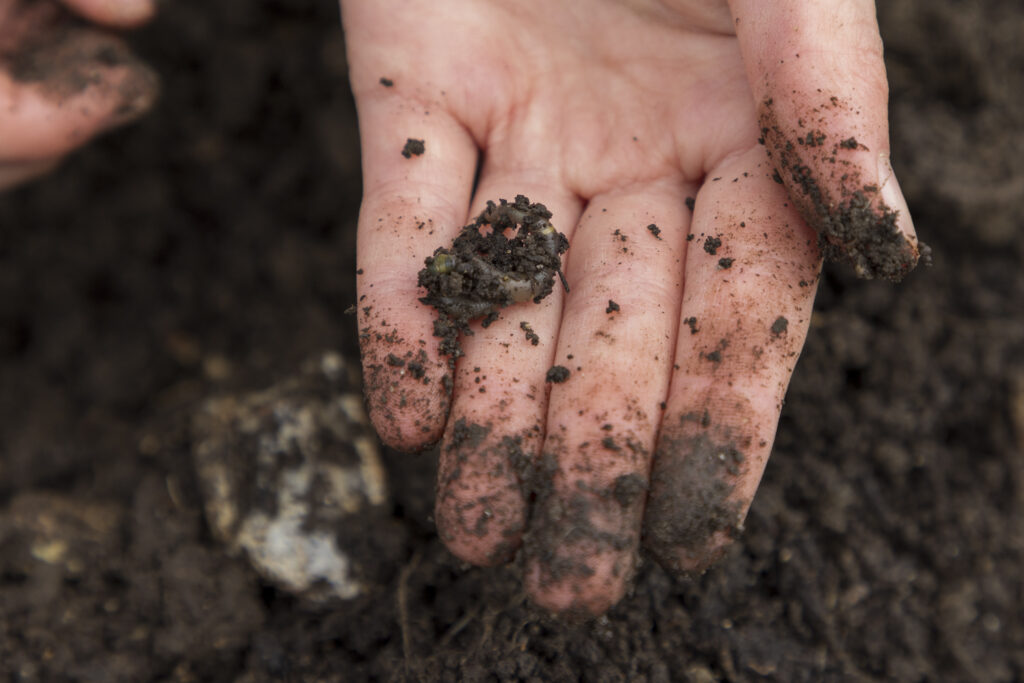
We identify three types of worms, described below, and juveniles which have not yet developed a saddle. To find out more about how we take the sample, see one of our previous blogs, Worming our way into soil health.

Epigeic worms (surface worms) 

  • These worms live in the leaf litter at the surface.
  • Dark, red-headed worms. They are of small size (less than 8cm).
  • Often fast-moving (good for escaping from birds and most likely to escape from the worm pot!)
  • Sensitive to: digging (which is detrimental) and a lack of organic matter on the surface. They are prey for native birds.

Endogeic (topsoil earthworms)  

  • Pale-coloured and green worms (not red)
  • Small to medium size 
  • Often curl up when handled. These are the most common earthworm group in our plots.
  • Sensitive to: Increased organic matter (beneficial) 
  • Roles: Nutrient mobilisation for plants

Anecic  (deep burrowing earthworms) 

  • Milky-coloured worms, with increasing red or black pigmentation towards the head. 
  • Large size (over 8 cm), typically similar size to a pencil. Make deep vertical tunnels, up to 2m. 
  • Often found below surface earthworm casts or midden residue piles. Feed at night, foraging the soil surface around their burrow for litter.
  • Often absent from ploughed fields (ploughing destroys their burrows) and where there is no surface litter.
  • Roles: Deep burrows that improve aeration, water infiltration and root development. 

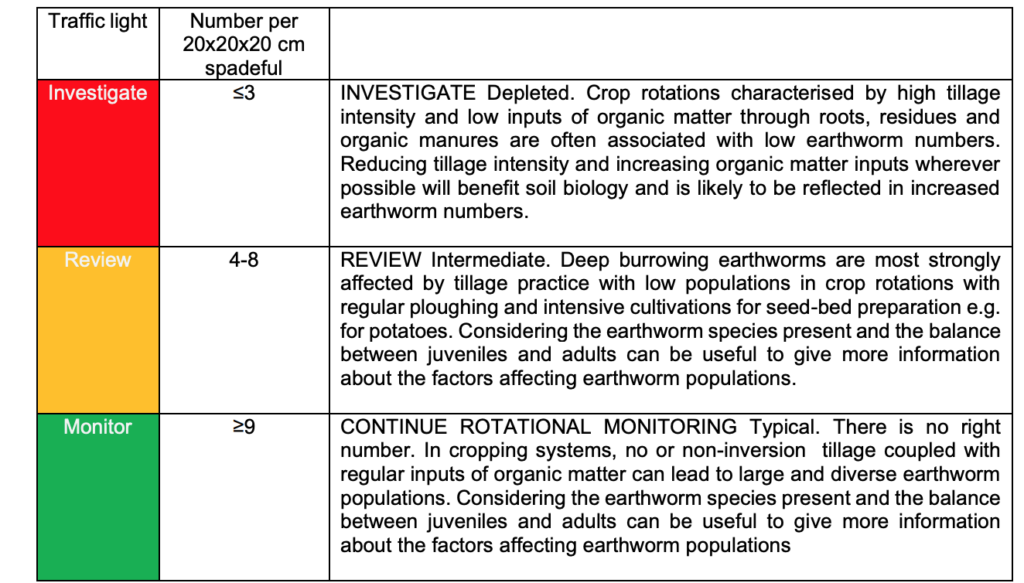
A traffic light system to assess the results

A traffic light system to give an indication of the results has been developed by the Agriculture and Horticulture Development board (AHDB) for the sampling technique that we have used.

Comparing results over time

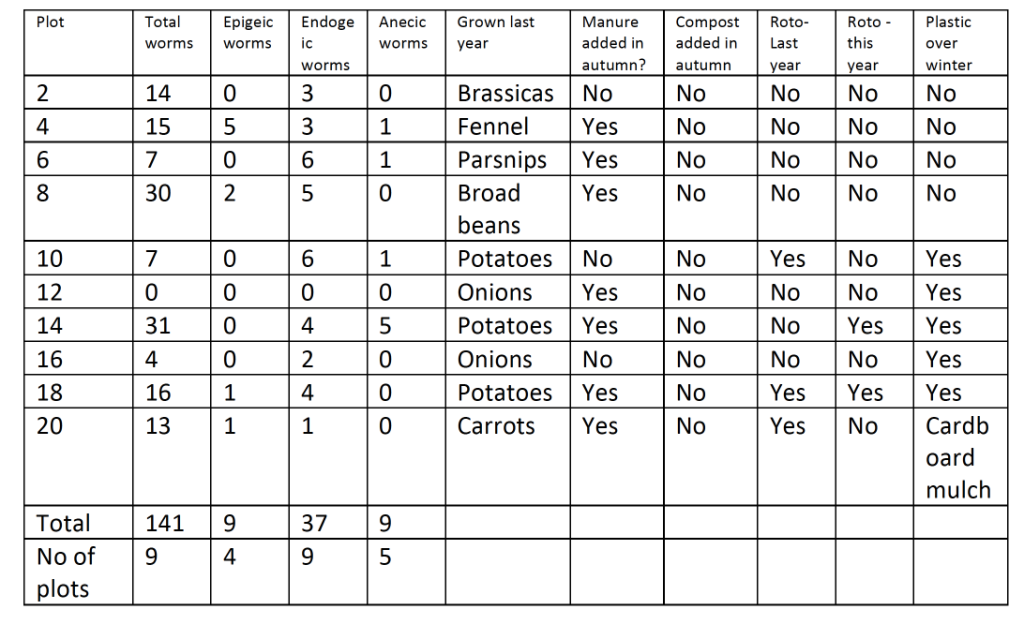
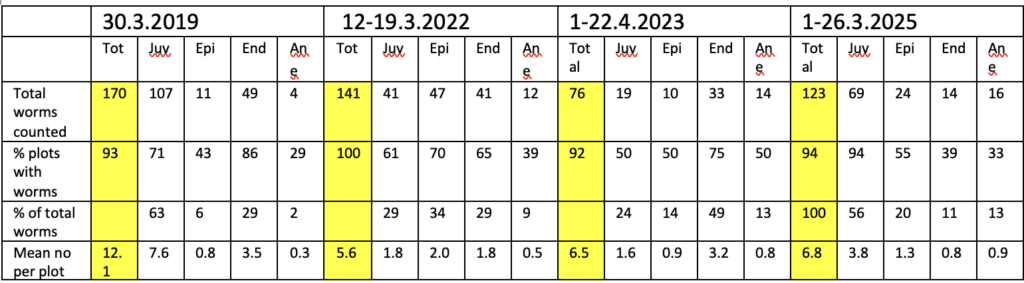
We have been counting the numbers of earthworms on our plots since 2019 to gain an impression of soil health. This table compares the results from March 2019, March 2022, April 2023, and March 2024 compared, with the plots on the left. The colours in the first column of the data come from the Agriculture and Horticulture Development Board’s traffic light system.

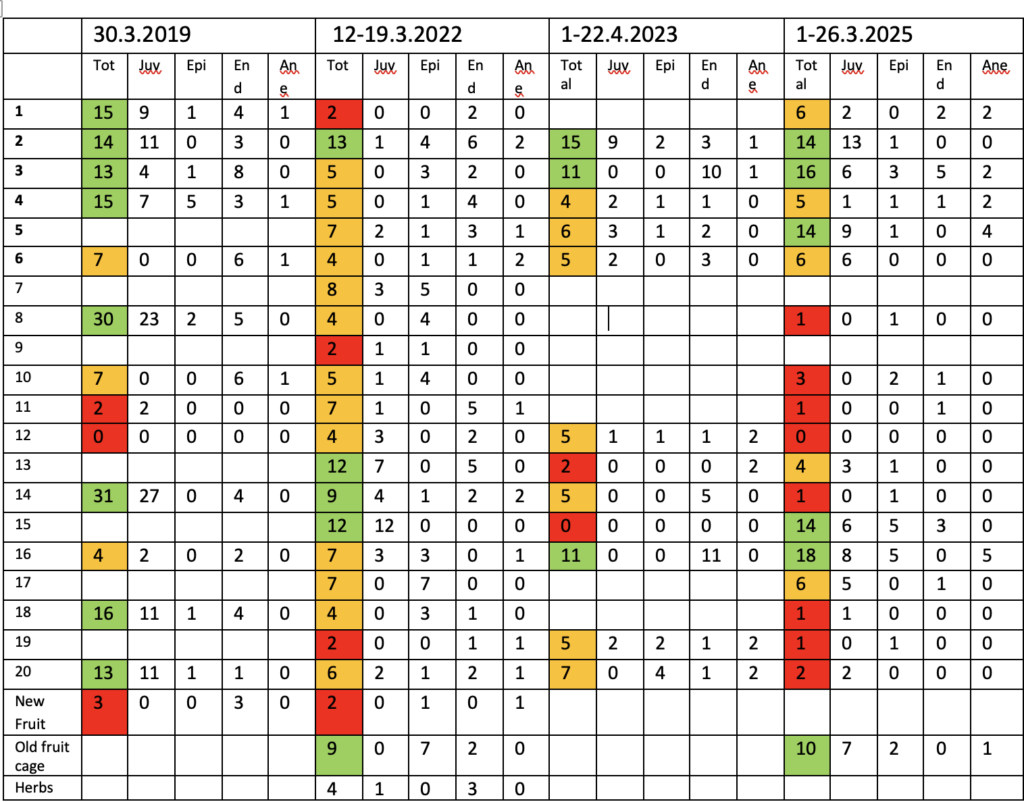
The 2025 results suggest that there are a surprising number of plots where the sample revealed very low numbers of worms (identified by the red or orange boxes).

Other plots (identified in green) seem to be doing well with several plots recording worm counts of 14-18 worms per sample.

Summary of results across the Farm

What do the results suggest? 

Estimates of the total numbers of worms went down from 2019 until 2022 but they have been rising slowly since. We are not sure why. Is it changes in the weather? Or changes in the soil? Or have numbers been affected by more moles moving into the site? (Moles only move into rich areas of soil which is an encouraging sign of soil quality.) However, an ecological principle is that predators (the moles) do not determine the population size of the prey (the worms) so the presence of moles is unlikely to be the cause of the decline in worm numbers.

As you can see from the graph below, there have been changes in the percentages of each of the three types of worms and the percentage of juvenile worms, but because of the relative inexperience of some people undertaking the identification, there are likely to be a significant proportion of worm misidentifications.  It is good to see a small rise in average numbers of epigeic worms per plot, which suggests that more organic matter is being left on the surface for these worms to hide in and feed on. It is also good to see a small rise in average numbers of anecic worms per plot and this may be because an increasing number of plots are adopting a “no-dig” approach and so their burrows are not being damaged by digging and remain intact. It is disappointing to see a decline in the numbers of endogeic worms.

We still cannot account for the very low total worm numbers on certain plots. In future years, we suggest that plots with very low numbers which bear a red flag are repeat sampled (perhaps by more experienced samplers) to try to determine whether this is a random sampling error or if this is uniform across the plot and the low worm numbers are the result of an unhelpful growing practice.

Earthworm sampling continues to give us valuable insights into the health of the soil that we need for successful crops. Please let Andrew Ross know of any thoughts you have.

Turning around our soil problems


You might think that loading your soil with compost, manure, or woodchip can only be a good thing, enriching it and adding to its ability to nourish crops? We thought the same – until Dr Andrew Ross took a closer look at our soil. It turns out that we’ve got a problem. Our soil has too much phosphorus and rapidly declining levels of potassium.

How did we get here? And, more importantly, what do we do next? Andrew Ross takes up the story.

Improving water retention with organic matter

When we were offered the Highbridge Community Farm field way back in February 2010, I took samples of the soil and analysed them in the College lab where I taught. They had between 4-6% organic matter in them. This was a fairly good level that held lots of nutrients for the plants.

But over the next few years, as we came across droughts and water shortages, we realised that more organic matter in the soil would act like a sponge and hold more water. So we chucked on the manure and compost and woodchip and our local council’s recycled green waste called Progrow. The organic matter level rose to 13% and we just about doubled the water holding capacity of the soil (about 90 litres per square metre in the top 30 cm when the soil is at capacity). 

Then came the first problem. Lots of swedes and turnips died. It turned out that the Progrow had raised the pH of the soil to 7.5-8. At that high pH level, the plants couldn’t absorb boron and they died of a shortage. We’ve managed to get the pH down to 6.9-7.2 and everything grew well again.

The phosphorus problem

In 2019, we decided to have some professional soil tests done. Since 2019, we have had the soil analysed every two years and plan to repeat the analysis in October this year. You can read about these analyses in a previous article here.

These soil tests revealed level 8 phosphorus. The scale goes up only to 9 and the target level for growing vegetables is level 3 so you can tell that we had a problem.

Figure 1. The latest set of soil test results (October 2024)

Figure 2 summarises the phosphate results for each set of tests. Plants don’t require lots of phosphate and, very often, fertilisers can contain a lot more phosphate than they need. Over the last five years, our plants have taken up some phosphate but not sufficiently to lower the levels in the soil. This is because of small additions of manure, compost or woodchip which seem to keep the phosphate level more or less steady.

Figure 2. The 3 sets of phosphate results in mg/l

When crops like potatoes and tomatoes grow, they take up quite large quantities of phosphate as Figure 3 shows, but most of the other crops take up relatively little. If we keep adding materials to the soil, the phosphate level could rise further into the danger level of 9.

Figure 3. Nutrient removal by selected vegetables (adapted from New England Vegetable Management guide) in g per square metre of plot or mg per litre of soil.

Just four barrow loads more of compost

Photo: HCF wheelbarrows (Steve Grundy)

We have now worked out that if we added 4 barrow loads of compost (weighing 100 kg dry weight and containing 1% Nitrogen (N), 1% Phosphorus (P), 1% Potassium (K), which is typical of compost), then that load would contain 1 kg each of nitrogen and phosphorus and potassium. Spreading that over 200 m2 of a plot and mixing it with the soil to a depth of 30 cm will add 5g of each nutrient per sq m or 16.67 mg per litre of soil.

So putting just 4 barrow loads of compost could raise the phosphate level by 16.67 mg. If that had been done over plots 5-8 in October 2023, that would have raised their phosphate level to 279.7 which is dangerously close to the threshold of level 9 which is 280! And that is why we are trying to add as little compost or manure or woodchip to our plots as possible at this time.  

We know that if the phosphate concentration rises to level 9, plants can show calcium deficiency. They show this with browning and dying of new growth at the tips of leaves and roots and a reduced ability to absorb the micronutrients Iron and Zinc. (Iron deficiency in a plant is characterised by strong yellowing of young leaves.) In addition, there can be poor seed- and fruit production and a greater susceptibility to disease. These are not things that we want to happen and why we must continue to aim at reducing soil phosphate.

The potassium issue

We have the opposite issue with potassium. Plants take up lots of potassium from the soil. and some is washed down out of the soil by excessive rainfall, particularly if the soil is not covered with growing plants. Studies indicate that potassium lost by drainage from soil is approximately 0.5 g or 500 mg per square metre for every 100 mm of through drainage. We had 1000 mm of rain at the farm last year. That is one of the reasons why many teams are planting the cover crop Phacelia over the winter period. Phacelia keeps the soil covered and protects it from heavy rains which leech nutrients down, while pulling up washed-down nutrients with their deep roots. 

You can see from our results in Figure 5 that the potassium levels have gone down steadily from level 6 to level 5 then to level 4. By October this year, they could be as low as level 2+ which is as low as we would want them to go.

Figure 5. The three sets of potassium results

So, we might need to add potassium to some crops this summer or next year if we begin to see nutrient deficiencies in any of our crops. Plants respond to low potassium levels with leaves turning yellow, especially at the tips, or the margins will crinkle and curl. Then they might go brown and the tissue might die. Plants appear stunted and have poor flowering or fruiting.

Choosing a fertiliser

Figure 6. NPK levels in natural fertilisers (taken from a variety of sources)

The best fertiliser on the list is muriate of potash (potassium chloride), while potassium sulphate (0.0.50), potassium magnesium sulphate (0.0.22) and potassium nitrate (13.0.44) have large quantities of potassium.

But are these fertilisers organic? And does that matter? 

Of the other definitely-organic fertilisers in the table, seaweed fertiliser looks to have the greatest quantities of potassium while having low levels of phosphorus, so that may be the best alternative. And that’s a decision for HCF in the future. 

Thanks for reading.

As a community, we’re grateful for Andrew’s commitment to the science behind growing. The chemical analysis of our soil allows us to understand what’s happening in it and to explain the consequences for our plants. We can change the recommendations for the growing teams to give our soil the best chance to thrive. Ongoing testing will show whether we’re back on the right track and whether any more adjustments are needed.

Let us know your thoughts and questions.

Some useful references:

Managing our soil

To grow good crops, we need healthy, balanced soil. Andrew Ross writes about our soil tests and how the results from these and our local weather are informing the way that we will manage the plots over the next year or two.

Three sets of analyses

Over the past five growing seasons, we have had 3 sets of soil analysis:  April 2019, April 2022 and October 2023, whereby 20 small samples from 4 plots (1-4, 5-8 etc) were grouped together and analysed.

What have we discovered?

Organic growers are encouraged to have high levels of organic matter in their soils because it acts as a sponge holding large quantities of nutrients and water. Over the years, we have been piling on the manure, compost and woodchip and so we have raised our organic matter levels to around 12-15%. 

The analyses show that our nutrient levels are high which is generally good, but the big problem has become our soil phosphate level. 

Phosphate levels have stayed stubbornly around 254 mg/l which is way too high and really needs to be reduced to below 100 mg/l. Phosphorus (P) is not directly toxic to plants but, at high levels, it can inhibit the uptake of iron and zinc. This year, we have been seeing raspberries and parsnips showing signs of iron deficiency.

Another feature of high phosphate levels is that, attached to soil particles, they can run off into rivers especially in wet weather and cause eutrophication (excessive richness of nutrients in the water). Phosphates from farming are damaging the rivers like the Itchen that run into the Solent and so both Eastleigh Borough Council and Natural England have phosphate mitigation strategies in place. 

What will we do about the high level of phosphate?

These high levels of phosphate mean that we are going to:

  • Continue with the ban on adding manure to the plots
  • Stop adding woodchip to the plots
  • Continue to make our own seed and potting-on compost so that we don’t bring more phosphate on to the site.

During a growing season, most crops will take up between 13-75 mg/l  of phosphate (which we take away and eat). More will be removed from the plots to the compost bins in crop residues and weeds. But relying on reducing phosphate by this method alone could take several years to achieve healthier levels. In the meantime, other substances will become depleted. So, we will be trying a few other ways as well.

  • Growing winter cover crops such as Phacelia which will add extra organic matter to the soil but not extra phosphorus. 
  • Growing winter crops like leeks and kale which will remove more phosphorus.
  • Growing the nitrogen-fixing field beans or winter tares (a green manure) during the winter which, if cut down before the beans develop, will add extra nitrogen and organic matter without adding more phosphorus.
  • Hoping that, over time, some phosphorus will be converted to the more stable form called “rock phosphate” that has a very limited solubility in the soil.

Levels of nitrogen (N), potassium (K) and magnesium (Mg) will inevitably fall so we might have to add to the soil inorganic fertilisers such as ammonium nitrate, urea, potassium sulphate, magnesium sulphate and possibly wood ash (which contains lots of K and Mg but some P (phosphorus) as well) to keep up the levels of other plant nutrients. 

Rainfall and our management of the plots over winter

No-one can have failed to notice the amount of rain we have had this year. The average annual rainfall at Highbridge is 802 mm or 802 litres per square metre. A few days ago, we exceeded this amount for 2023 and the cumulative total is already nearing 850 mm. And we still have the normally-wet months of November and December to go!

While this reduces the amount of watering that we have had to do, it can make life difficult too. Root crops like potatoes, carrots and parsnips are more difficult to dig. The soil can become compacted by our trampling on it. Crops go mouldy quicker.

If we get lots more rain this winter on our sodden, waterlogged soil, nutrients can run off the surface or be leached down through the ground.

Minimising run off

To minimise this, all teams are being encouraged to grow plants over the winter on all plots. The plants will help to intercept the rain, reduce surface compaction and runoff and pull back up into the plant roots the nutrients that could otherwise be leached. 

More ways to enrich our soil

As well as our winter crops like kales, leeks and parsnips, several teams have been planting the green manure called Phacelia. In the Spring, if we don’t have any severe frosts that kill it, the Phacelia can be cut off, chopped up on the soil surface and left to the worms to pull the decaying bits into the soil. This adds organic matter to the soil.

Other teams who will be planting potatoes next Spring have been planting “spud mix”  – a  mixture of mustard and radish.  Next Spring, the mustard and radish can be dug up and immediately turned straight into the ground. This releases a chemical which kills the wireworms that would otherwise make holes in potatoes. 

It is now getting too late to plant Phacelia, but we are hoping that the weather will be kind to us and give us a window of a few weeks. This will allow teams that missed the Phacelia sowing an opportunity to plant field beans or winter tares. These have the additional benefit of being nitrogen fixers as well as soil cover crops. 

Soil testing has given us valuable insights into the state of our soil and the opportunity to rebalance in a natural way. We’re also doing all we can to mitigate the effects of recent heavy rainfall. What do you do to keep your soil as healthy as possible?

Weather, watering and crops – using water wisely

Andrew Ross explains how much water our crops need in warm weather – possibly much more than you thought!

Water meters help us to discover the condition of the soil and new solar-charged irrigation is taking some of the load – but we still depend heavily on stakeholders with watering cans!

The irrigation project

Mike Lucas has recently completed Phase 1 of our irrigation project. It is all run on solar energy and draws water from the pond. A panel collects the sun’s energy which is stored in a battery for night use or cloudy day use. One of our pumps is capable of pumping 200 cu m of water per month into our IBCs at a slow but steady rate. The other pump feeds the standpipes situated along the Roman Road. Hopefully, gone are the days of using a petrol burning engine and lugging heavy and leaky standpipes (although they remain in reserve).

Mike will be beginning some experimental work on Phase 2 this summer, using timers attached to the IBCs and drip feeds to small areas of appropriate crops.

Rainfall, evapotranspiration, and watering

We are now entering the time of year when evaporation from the surface of the soil and from plants generally exceeds the rainfall and so we need to make up the difference with irrigation. (1 mm of rain is equal to 1 litre of rainfall or watering on a square metre).  

Last week at Highbridge Community Farm, around 25 litres of water evaporated from each square meter of vegetated land!

With normal June weather, we can expect around 92 litres of water to be lost from each square metre over the whole month. If the weather is hot, dry and windy, this might even be more! So, if we should have a dry June, July and August like 2022 with a total of only 60 mm rain, we will have to do a lot of watering. Our watering cans hold 10 litres.  If no rain falls in June, each square metre of actively growing plants will need around 9 or 10 watering cans of water over the month – that is 2 or 3 cans of water per square metre per week.    

We have added a lot of organic matter to our soil which acts like a sponge holding water. The top 30 cm of soil will hold about 90 litres per square metre when at its field capacity. As the soil dries out, plants grow less well and stop growing when the amount of water in the top 30 cm falls to about 60 litres. By the time the soil has only 30 litres of water left in, it most of the plants will have died!

Watering your crops

  • Please do water your crops thoroughly, particularly if little or no rain has fallen. It isn’t sufficient just to wet the surface. You need to see an increase in the moisture levels down to 10 cm and ideally to as far as the roots grow down and to where you find that the soil is already wet.

This is a moisture meter. Use this before and after watering. Holding the metal sensor, push it into the soil to a depth of 5 cm and read the gauge. Push it in about 10 cm and read again. After watering, the readings at 5cm and 10 cm should be at least a MOIST 6 to a WET 8 on your scale.   

  • For most crops (except salads), it is better to water a bed thoroughly with 2 or 3 cans of water per square metre once a week than to sprinkle a can over a whole bed every day as most of that water will not infiltrate more than 2 or 3 cm. This is because deeper roots will not receive any water and a lot of the surface moisture will simply evaporate away very quickly.  
  • Ideally, water in the evening (or early morning) to give plants the opportunity to take up as much water as possible. Water the soil, not the plants. 

Water is a limited resource. Use it wisely!

Worming our way into soil health

Andrew Ross organises regular surveys of earthworms in our soil at Highbridge Community Farm. He explains why we do these surveys and what we learn.

Why we do worm surveys

Having a healthy soil is important if we wish to grow healthy, nutrient rich plants at Highbridge farm and eat healthily ourselves. Worm surveys are one of a few ways we use to monitor the health of our soil. We also have a nutrient analysis conducted every two years or so, which tells us the levels of organic matter (a measure of carbon and nitrogen levels), phosphorus (which is higher than we would wish) and potassium.

The National worm survey

In early February and March 2018, Dr Jackie Stroud, a Natural Environment Research Council Soil Expert at Rothamsted Research, led a project to study the worms in farm soils. A total of 126 farmers took part. We joined the project in 2019 following the national method, and have done a survey annually since, with the exception of last year, when the soil was so dry that there were very few worms in the top 20cm of soil.

How we do the survey

Each team digs a soil pit 20cm x 20cm x 20cm on their plot and removes all the soil to a tray. They then carefully sort through this sample and remove any worms they find into a smaller pot containing a little water (to keep the worm skins moist for breathing). Then we count the total number of  worms in the sample and then divide them into adults and juveniles. Adults are identified as those having a saddle on their bodies which juveniles don’t have. The juveniles are counted and then returned to the soil. The adults are then sorted into one of three groups of worms with different roles in the soil ecosystem before being counted. Then all worms are returned to the soil. 

Epigeic worms are small or medium sized darkish red worms that live on or very near the surface of fields with abundant leaf litter and feed on the leaf litter and deposit smaller, broken-down bits in the leaf litter for other organism to feed on, so accelerating the breakdown of leaf litter. 

Endogeic worms are small or medium pale worms which are grey, pink or green or bluish. They make horizontal burrows through the soil to move around and to feed. In doing so, they mix soil and help release nutrients for plant uptake and so help to raise crop productivity.  

Anecic earthworms are the large pencil sized worms which were heavily pigmented red or black . They make permanent vertical burrows in soil. They feed on leaves on the soil surface that they drag into their burrows.  They also make middens (piles of casts) around the entrance to their burrows. The are great for making long vertical holes in the soil which improves drainage and allows more oxygen to get to the plant roots.

Earthworms in the Ecosystem (c) Rick Kollath (all rights reserved), taken from https://www.earthwormsoc.org.uk/earthworm-ecology. Click on the image to visit the illustrator’s website.

Our results 

The table shows the number of adults counted each year in the soil sample taken from the even numbered plot. The figures list the numbers of first epigeic, then endogeic and then anecic worms. 

Plot2019202020212023 – to come
20,3,03,0,1na
45,3,16,2,21,3,1
60,6,10,0,00,0,0
82,5,01,6,1na
100,6,11,0,01,0,0
120,0,01,2,02,2,0
140,4,5na0,0,0
160,2,00,6,10,0,1
181,4,01,0,0na
201,1,00,0,12,0,2

Average per plot 
14.17.147.42
Average juveniles8.64.144.33
Average epigeic0.91.31.3
Average endogeic3.71.20.8
Average anecic0.80.50.9
Number of adult earthworms counted each year in the soil sample

Our results suggest that the numbers of adult worms went down from 2019 to 2020 and 2021. There are two possible explanations for these results. Either our farming practices are harming the soil for worms or changing seasonal weather (drier weather) may cause the endogeic and anecic worms to move lower in the soil. Rainfall for the months of January to March in Allbrook is shown below.

Month20192020202120222023
Jan 291028825148
Feb7416268725
Mar8761185596 (to Mar 27th)
Rainfall for January to March 2023 in Allbrook

This March has been the wettest in 5 years, so we are hoping that our worm numbers will be higher than in the last couple of counts and that worm numbers are more strongly influenced by soil moisture and not by our harmful farming practices!

What the each group of worm results will tell us

Epigeic worms tell us if there is sufficient plant material remaining on or near the surface of the soil for these worms to feed and hide in and thus survive. Intensive cultivation, clearing of crop debris and long periods of bare soil often result in a reduction of these numbers and so less organic matter is made available to soil dwelling organisms and the soil ecosystem begins to break down..

Endogeic worms do a lot of the mixing of the soil and making nutrients available where the roots are growing. These are usually the last group of worms to decline in a soil.

Anecic worms feed on leaf litter at night and pull leaves and organic debris from the surface down into the earth. When the soil is dug their permanent burrows are disrupted and frequent digging often causes a decline in their numbers and a subsequent loss of aeration and drainage channels in the soil. It may be that the teams that practice minimum dig (Teams 1-4) and using green manures (Team 3-4) will have higher numbers of certain types of worms. All this will be revealed by the data we collect. 

For further information, see Mariko White.   What can worms tell us about our soils?  (Hampshire and Isle of wight Wildlife Trust. Published online 31.7.2019).

HCF soil carbon

This article was written by Andrew Ross.

Recently we had two Highbridge Community Farm soil samples analysed by the Soil Association. The samples came from plots 3&4 which have been practicing minimum dig and planting winter cover crops for two years now, so the soil here should be among the best on the farm.

What was in the samples?

The samples showed that soil organic matter was 11.2% on plot 3 and 12.6% on plot 4.

Soil organic matter is a complex mixture of all organic material found in the soil including living components (plant roots and microorganisms) and dead components (leaf litter and humic substances). It increases the soil water-holding capacity and provides a slow release source of energy for microorganisms which increases the cycling of nutrients within the soil.

These samples suggested that the total organic carbon stock in tonnes of carbon per hectare of land to a depth of 30 cm would be in the range of 199-212 tonnes for this part of the farm.

More Soil organic matter means better growing conditions

The implication of this analysis is that our soil organic matter has risen from around 4% when we took on the land in 2010 to 12% in 2021.

This organic matter acts like a sponge and the top 30 cm of our soil now holds around 90 litres of water per square metre when it is at field capacity (full of water- but not waterlogged) instead of about 45 litres if there was no organic matter present. There are also many more nutrients available for our crops to grow well.  

Photo credit: Steve Grundy

Plus, OUR plants REMOVEd carbon dioxide from the atmosphere

As well as improving our soil considerably we have effectively removed carbon dioxide from the atmosphere as the plants photosynthesised and made the atmospheric carbon dioxide into plant biomass which was then recycled and added to the soil as compost (along with manure). This is known as soil carbon sequestration.

beware of short cuts

Recently I attended an online Soil Association Symposium where I learned that companies are concerned about their contributions of carbon dioxide to the atmosphere because this is promoting global warming.

In their desire to appear “green” or environmentally-friendly, some companies are offsetting their CO2 (carbon dioxide) production by paying others to plant trees, restore wetland peat bogs (which are great for sequestering carbon) and even paying farmers to sequester carbon in their fields. One figure quoted was a payment to a farmer of £23 a ton for each ton of carbon sequestered.

The danger of this system of carbon offsetting is that it can become like the selling of Indulgences by the Roman Catholic church during the Middle Ages which allowed sinners to go on sinning. We don’t want to see companies paying money for carbon sequestration but being allowed to go on polluting the environment with chemicals or even carbon dioxide. Nor do we want to see woodland owners taking the money to plant trees or farmers taking the money to sequester soil, only for them to plough up the land again in 10 years time! 

We live in a complicated world.

Improving the soil with leaf-mould

This article is written by Andrew Ross.

Many people recognise the problems created by leaves at this time of year. Yet they can be of great value if used as leaf-mould for the soil in your garden or allotment. We make great use of them at Highbridge Community Farm. Find out how to make and use this rich ingredient.

Why is leaf-mould useful?

It’s not that leaves have great nutritional value. The tree tends to suck the nutrients out of the leaves before they drop them. Well-rotted leaf-mould greatest benefit is as a soil conditioner, improving the structure of a soil, rather like peat, but without the damaging environmental costs of extracting peat. Leaves tend to have a high Carbon:Nitrogen ratio, averaging around 50:1 and low levels of essential nutrients: Nitrogen 0.66-1.62%, Phosphorus 0.02-0.29%, Potassium 0.09-0.88%. Leaves also contain useful amounts of Calcium and Magnesium.

How do you make leaf-mould?

First brush up your leaves or rake them off a lawn. We actually collect several wheel-barrow loads from our road. Then there are several options for making use of it:

1. Store leaves in bin liners. Moisten the leaves if they are dry and prick holes in the bag. Tie loosely, pile up the bags and leave in a quiet spot for up to two years.

2. Build a chicken wire frame in a hidden corner of the garden about 1m3 and pile up with leaves. Turn the pile occasionally. This is what we do at Highbridge Community Farm.

3. Store in an open topped barrel or compost bin with drainage holes at the bottom for up to 2 years.

4. Put layers of leaves as your brown material in a compost bin and alternate with green material such as grass clippings, weeds or food waste.

5. Cover frost sensitive plants which die back in the autumn to protect the plants from winter rain and frosts. You can make a wire frame around a plant such as a banana after the trunk has been cut off, then pack and insulating layer leaves around the stump and cover the stump with a plastic bag.

Which leaves are best to use?

Leaves that will quickly break down include: ash, beech, birch, cherry, elm, hazel, lime, hornbeam, and willow.

Leaves that slowly break down include: hawthorn, maple, magnolia, oak, sycamore and horse chestnut.

The best leaves to use are oak, beech and hornbeam.

Evergreen leaves should be shredded first as they take a very long time to break down. They include: holly, bay, rhododendron, photinia and skimmia. Conifer needles take a very long time to break down even if moistened and turned every few weeks, so they are best used as a mulch over acid-loving plants such as blueberries and azaleas.

How do you use leaf-mould?

Some plants such as vegetables, annuals and grasses prefer soils dominated by bacteria so it is best to use compost or well-rotted manure as soil conditioners for these groups. The bacteria quickly break down the organic material which generally has a higher level of nutrients and a lower Carbon:Nitrogen ratio.

Leaf mould contains lower nutrient levels plus lots more carbon locked up in complex substances like starch, lignin and cellulose which fungi tend to slowly break down. So, leaf-mould is better used on trees, fruit bushes, shrubs and perennials which prefer soils dominated by fungi. Well rotted leaf-mould should be added to the soil surface of these groups as a mulch in the autumn or spring to help build the soil mycorrhizal fungi. The mycorrhiza will bring more water and nutrients to the plant roots and so help to create stronger, healthier plants.

An alternative use of leaf-mould is to dig it into the soil when it has been partially broken down to raise the humus content of the soil. This is especially useful for heavy clay soils or light sandy soils. As well as improving soil structure by providing more food for soil living organisms it will help the soil to hold more water to enable the plants to tolerate drought better and hold more nutrients bound onto the humus.

Finally, leaf-mould can be mixed with sharp sand, garden compost and soil and used as a potting compost.

Inspired? Let us know if you use Andrew’s advice to improve your soil with this free, natural material.

The power of soil organic carbon

This is the first in a series of articles written by Andrew Ross to get us thinking about the quality and impact of the soil at Highbridge Community Farm.

Soil with high organic carbon isn’t just a good growing medium. It can help reduce atmospheric CO2 on a worldwide basis – a win for farming and a win for the planet. So, is there more we can do to increase the organic carbon levels of the soil at HCF? 

Most of us are familiar with the broad issues of climate change:

  • An increase in atmospheric carbon dioxide (CO2) concentration from 278 ppm in the pre-Industrial period (circa 1750) to 405.5 ppm in 2017
  • An increase of the greenhouse gas, methane, from 722 ppb to 1859 ppb in the same period.
  • An increase in nitrous oxide from 270 ppb to 330 ppb in the same period. (Lal, 2019)

This has already raised global temperatures by over 1⁰C since the Industrial Revolution with dire consequences, as exemplified by the increase in frequency of extreme events throughout the world. Furthermore there is the real likelihood that we will miss the target set at the Paris Climate Conference (COP21) in 2015 of limiting global warming to 1.5⁰C. (IPCC (Intergovernmental Panel on Climate Change, 2018).

The Highbridge Community Farm ethos statement says “We have evolved from the Transition Movement and retain their founding principles – a community-led response to the pressures of fossil fuel depletion and climate change, supporting local economies and moving towards a more viable and sustainable future. Now a mutual benefit co-operative society in our own right, we work together to produce food for ourselves with minimum use of fossil fuels and chemicals. We support growing techniques that maintain the natural balance of the soil, preserve wildlife and their habitats, and encourage biodiversity.”

Over our time as a community, our aim has been to grow good organic food. We have managed the soil to obtain good crops, without ever really addressing the issue of how to improve the health, fertility and productivity of our soil in an environmentally sustainable way. Ideally, this soil should be resilient to be able to cope with whatever crop is planted in it and cope with whatever combination of weather events that is thrown at it. Probably the best measure of soil health and resilience is one with a high organic carbon content.

Farmers Weekly provides a simple chart for farmers to score the quality of their soil according to the percentage of organic carbon that it contains:

  • Less than 1% – very low
  • Less than 2% – low
  • Less than 4% – medium
  • Less than 8% – high
  • Over 8% – very high

The IPCC Climate Accord, proposed in Paris in 2015, initiated the “4 per 1000 programme“. This aims to raise Soil organic carbon in world soils to a depth of 40 cm at the annual rate of 0.4% per year. The UK signed up to this initiative and Environment Secretary Michael Gove has undertaken to deliver on this ambitious goal by supporting soil health improvements in the UK.

Natural soils in Britain once contained 30-40% more organic matter than they now contain under cultivation. Most farmed soils in southern England now have less than 2% organic matter, but in the rest of the British Isles 2-6% may be found. Once organic matter levels fall to below 2% the impact can be severe. A fall in soil organic matter of 0.5% can reduce nutrient holding capacity by 4% of even fertile soils. Growers manage the levels of soil organic matter to get acceptable plant growth, which will typically mean that organic matter levels should be 3-6%. For us it should be at least 6%, preferably 8%.

There is an added benefit of raising soil organic carbon (SOC); the potential lowering of atmospheric CO2 on a worldwide basis by raising SOC is approximately 84 ppm of CO2. This burying of SOC in the soil in the form of humus is called sequestration.

So, raising SOC at Highbridge Community Farm will be a win:win. We can play our part at HCF to produce a better, more resilient and productive soil and our efforts will benefit everyone if global CO2 levels fall!

We’re going on a worm hunt.

In early February and March 2018, Dr Jackie Stroud, a Natural Environment Research Council Soil Security Fellow at Rothamsted Research, led a project to study the worms in farm soils. 126 farmers took part. They dug 10 pits in one field, each 20 cm x 20 cm x 20 cm, in one field. They counted the number of adult worms in the sample (adults are identified as those having a saddle on their bodies) and allocated them to one of three main types of earthworm. Each of these worm groups has a different function.

  • Epigeic surface worms (the small, surface, red ones) break down surface litter and are a good source of food for native birds, such as thrushes and blackbirds.
  • Endogeic topsoil worms (the medium, pale ones which are grey, pink or a darker green) mix soil and mobilise nutrients for plant uptake and so support crop productivity.
  • Anecic, deep-burrowing large worms (larger pencil-sized ones which are heavily pigmented red or black) are the drainage worms which can form vertical burrows of up to 2m deep. These help with water infiltration and deep plant burrowing.

In April 2019, we conducted the same experiment over our ten plots, with a few teams adding a second count. Our results are below and make interesting reading. They are just a snapshot but they give us a baseline for further monitoring and discussion.

Photo: Steve Grundy